UrbanAura Sales Report

Microsoft Excel
UrbanAura Retail Sales Dashboard
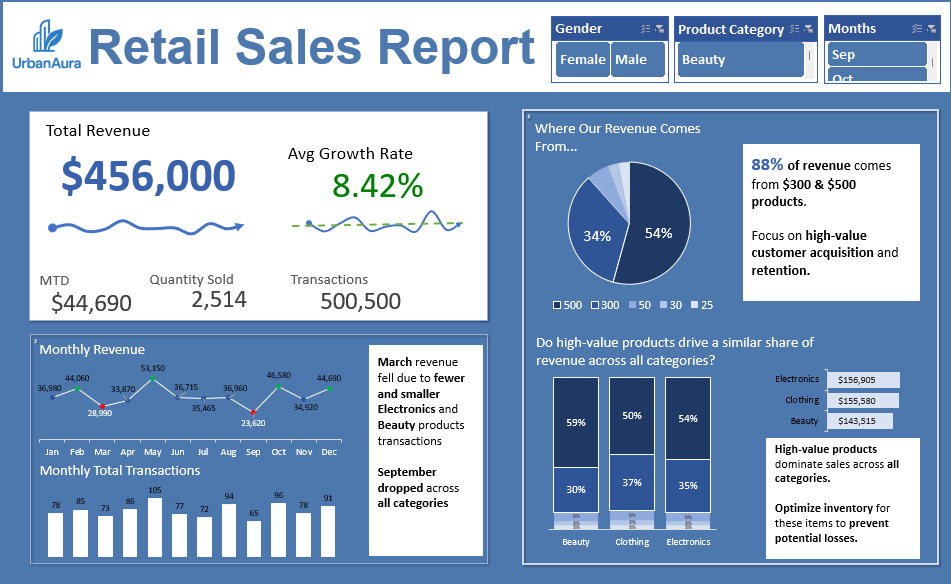
I developed a Retail Sales dashboard using Excel for a simulated retail company, UrbanAura, to analyze sales performance and customer behavior.

Insights:
  • Sales declined in March and September due to a drop in transactions, particularly high-value ones, for unexplained reasons.
  • 88% of revenue is generated by high-value products across all categories.

Recommendations:
  • Target acquisition and retention strategies for high-value customers.
  • Optimize inventory of high-value products and address slow-moving stock and low fill rates to prevent potential revenue loss.
View Dashboard

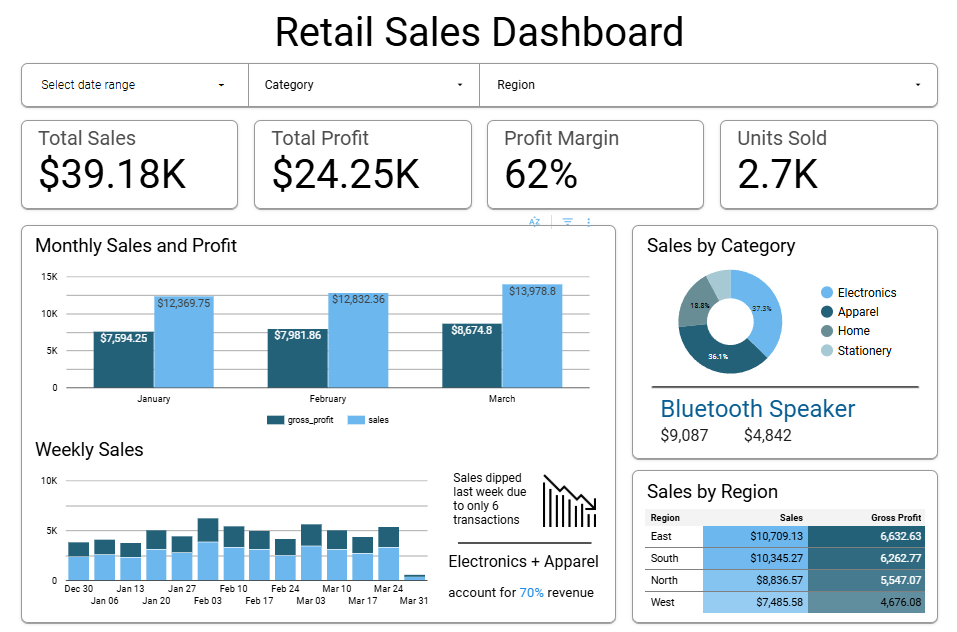
Retail Sales EDA and Dashboard

Looker Studio | Python (Pandas Scipy Matplotlib)

Retail Sales Dashboard
Performed an end-to-end Exploratory Data Analysis (EDA) of retail sales data in Python and built an interactive Looker Studio dashboard to uncover insights on sales, profit, customer behavior, and product performance across regions and channels, with trend and performance tracking

Recommendations:
  • Avoid blanket discounting strategies. Since discounts show no significant impact on sales, gross profit, or units sold, test personalized or seasonal offers instead for better ROI
  • Target consistent top-performing products (Bluetooth Speaker, Backpack, Desk Lamp, T-shirt, Phone Case, and Socks) for bundling and promotional packages
See documentation
View Dashboard

BMI Health Tracker Dashboard

Looker Studio | Google Sheets

BMI Dashboard
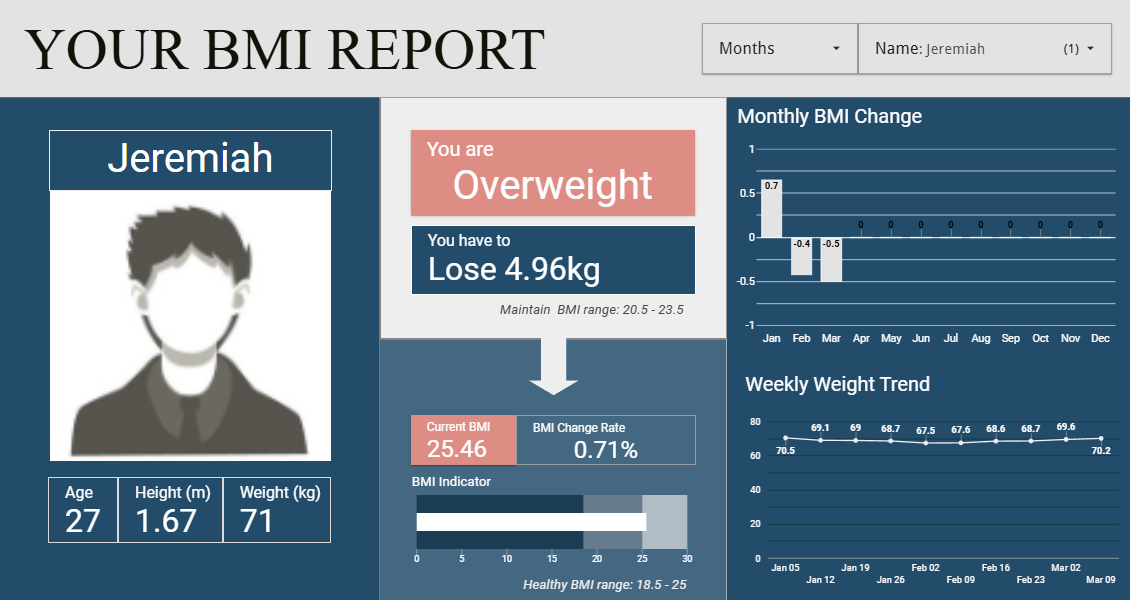
Developed an automated health tracking system in Google Sheets with custom formulas and integrated it with Looker Studio for interactive visualization. The dashboard enables users to monitor their BMI trends over time, providing a simple yet effective way to track health progress.

Features:
  • User inputs: Name, profile picture (optional), birthdate, height, starting weight, start date, and weekly weight updates
  • Automatic BMI calculation and real-time updates from weekly weight entries
  • Dynamic Looker Studio dashboard for clear and engaging health insights
View Dashboard

Client Project (Upwork): GA4 Dashboard Recreation

Google Analytics 4 (GA4) | Looker Studio

GA4 Dashboard
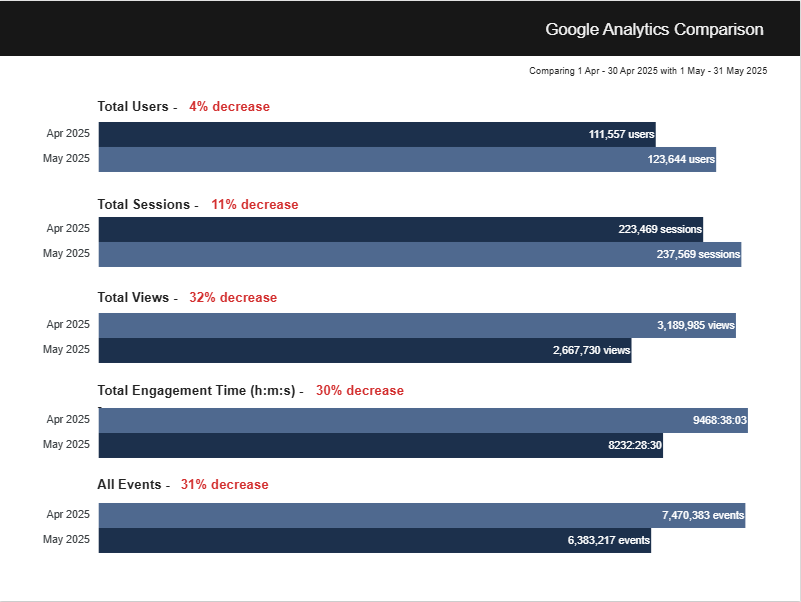
A client provided a static dashboard design (image) and asked me to recreate it as a fully functional Looker Studio dashboard using GA4 data. I ensured the recreated dashboard matched the design while also enabling interactivity and real-time data updates

Key Features:
  • Month-over-month comparison for 5 metrics: Total Users, Sessions, Views, Engagement Time, and Events
  • Accurate replication of the provided visual layout
  • Clean, minimal design optimized for quick insights
See client feedback in Upwork

Google Ads Performance Dashboard

Microsoft Excel

Google Ads Performance Dashboard
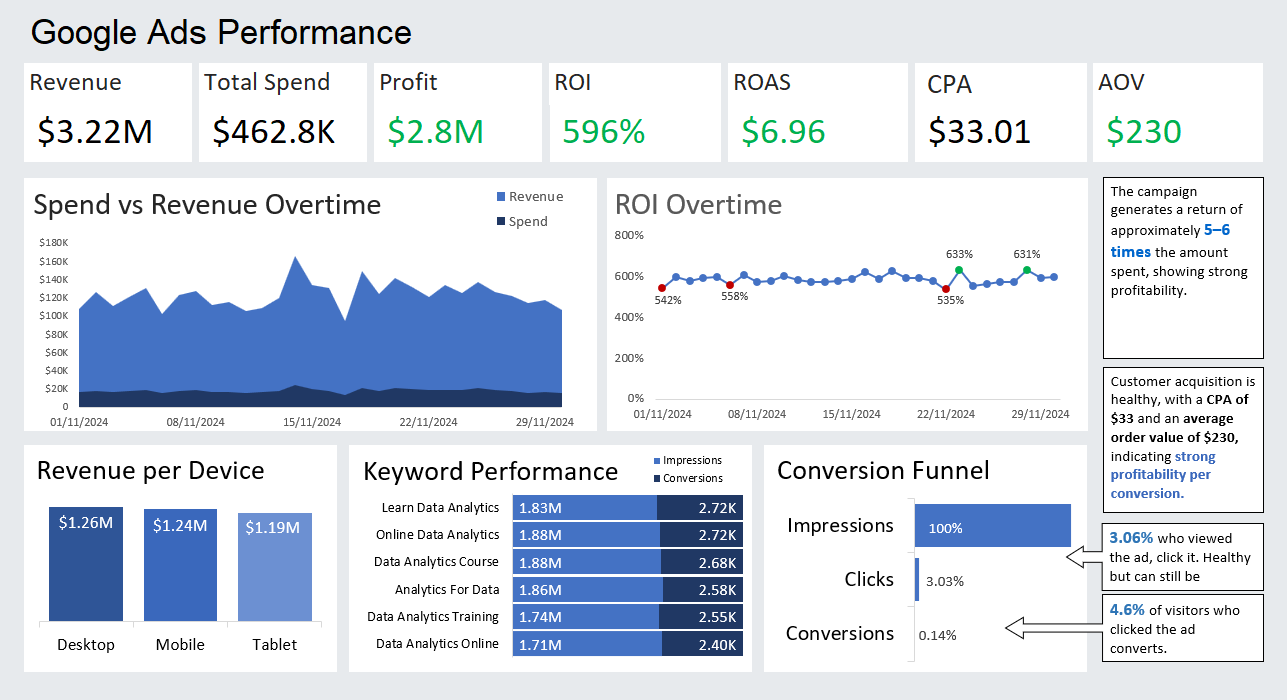
This project focuses on analyzing a simulated Google Ads campaign to evaluate profitability and marketing efficiency.
I performed full data cleaning and transformation in Excel to prepare the dataset for analysis and visualization. The cleaning process involved fixing inconsistent date formats, correcting spelling errors such as “analitics” and “anaytics", handling missing values, and normalizing text casing in categorical fields like “mobile,” “Mobile,” and “MOBILE.”

Since the dataset is simulated, it does not exhibit strong correlations among variables, but it effectively demonstrates the analytical process and dashboard design for performance monitoring.

Key Insights:
  • The campaign achieves a 596% ROI, returning 5–6× the total spend.
  • A CPA of $33 and AOV of $230 indicate healthy acquisition and solid profitability.
  • CTR (3.06%) and CVR (4.6%) show stable funnel performance with room for improvement.
See dashboard